Watching the World
The following first appeared in Aperture magazine #214 Spring 2014. Become a subscriber today!
Can the billions of images uploaded to digital platforms be put to work? Lev Manovich discusses the emerging field of social-media visualization.
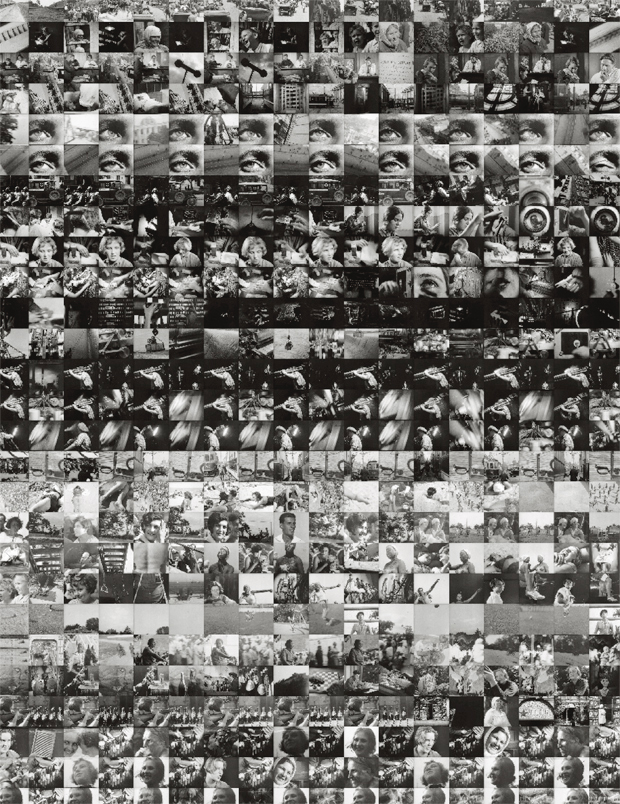
Jay Chow and Lev Manovich, Every shot from Dziga Vertov’s film Man with a Movie Camera (1929), 2012. Courtesy Jay Chow and Lev Manovich.
Last summer the Museum of Modern Art in New York asked the Software Studies Initiative, a program I started in 2007, to explore how visualization could be used as a research tool, for possible methods of presenting their photography collection in a novel way. We received access to approximately twenty thousand digitized photographs, which we then combined, using our software, into a single high-resolution image. This allowed us to view all the images at once, scrolling from those dating from the dawn of the medium to the present, spanning countries, genres, techniques, and photographers’ diverse sensibilities. Practically every iconic photograph was included—images I had seen reproduced repeatedly. My ability to easily zoom in on each image and study its details, or zoom out to see it in its totality, was almost a religious experience.
Looking at twenty thousand photographs simultaneously might sound amazing, since even the largest museum gallery couldn’t possibly include that many works. And yet, MoMA’s collection, by twenty-first century standards, is meager compared with the massive reservoirs of photographs available on media-sharing sites such as Instagram, Flickr, and 500px. (Instagram alone already contains more than sixteen billion photographs, while Facebook users upload more than three hundred fifty million images every day.) The rise of “social photography,” pioneered by Flickr in 2005, has opened fascinating new possibilities for cultural research. The photo-universe created by hundreds of millions of people might be considered a mega-documentary, without a script or director, but this documentary’s scale requires computational tools—databases, search engines, visualization—in order to be “watched.”
Mining the constituent parts of this “documentary” can teach us about vernacular photography and habits that govern digital-image making. When people photograph one another, do they privilege particular framing styles, à la a professional photographer? Do tourists visiting New York photograph the same subjects; are their choices culturally determined? And when they do photograph the same subject (for example, plants on the High Line Park on Manhattan’s West Side), do they use the same techniques?
To begin answering these questions, we can use computers to analyze the visual attributes and content of millions of photographs and their accompanying descriptions, tags, geographical coordinates, and upload dates and times, and then interpret the results. While this research began only few years ago, there are already a number of interesting projects that point toward future “computational visual sociology” and “computational photo criticism.” In 2009, David Crandall and his colleagues from the Computer Science Department at Cornell University published a paper titled “Mapping the World’s Photos” based on analysis of approximately thirty-five million Flickr photographs. As part of their research, they created a map consisting of the locations where images were taken. Areas with more photos appear brighter, while those with fewer photographs are dark. Not surprisingly, the United States and Western Europe are brightly illuminated while the rest of the world remains in the dark, indicating more sporadic coverage. But the map also reveals some unexpected patterns—the shorelines of most continents are very bright, while the interiors of the continents, with the notable exceptions of the States and Western Europe, remain completely dark.
Using their collected photo set, Crandall and his team also determined the most photographed locations in twenty-five metropolitan areas. This led to surprising discoveries—New York’s fifth most photographed location was the Midtown Apple store; Tate Modern ranked number two in London. A photo-mapping project created in 2010 by data artist and software developer Eric Fisher addressed a question likely prompted by such information: how many of these images were captured by tourists or local residents, and how does this distinction reveal different patterns? Fisher’s Locals and Tourists plotted the locations of large numbers of Flickr photographs by using color to indicate who took them: blue pictures by locals, red pictures by tourists; yellow pictures might have been made by either group. In total he mapped 136 cities, then shared these maps on Flickr. In his map of London we see how tourists frequent a few well-known sites, all in Central London, while locals cover the whole city but document less assiduously.
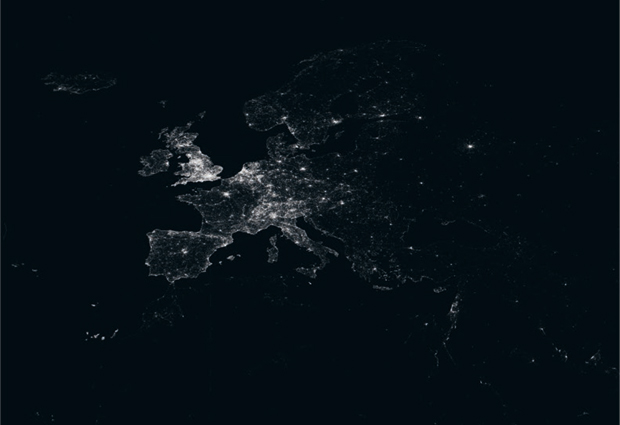
David Crandall, Lars Backstrom, Dan Huttenlocher, Jon Kleinberg, Mapping the World’s Photos, 2009 (detail). A map visualization of about thirty-five million geotagged photographs collected on Flickr. The white dots on the map correspond to photographs, highlighting popular cities and landmarks. Courtesy David Crandall.
These pioneering projects use metadata to reveal telling patterns in social photography. However, they did not use actual images in their visualizations, a practice first explored, to my knowledge, by artist James Salavon. For series such as Every Playboy Centerfold, begun in 1997, and Homes for Sale, 1999, Salavon composited a number of images to reveal the photographic conventions used to represent particular subjects. His more recent work, Good and Evil ’12, 2012, consists of two panels, each showing approximately twenty-five thousand photographs returned by a Bing image search for the one hundred most positive or negative words in English.
Media artists like Salavon demonstrate how visualization may uncover patterns in the content of large image collections. This is an idea my lab has explored further by developing open-source visualization tools that can be used by anyone working with images—art historians, film and media scholars, curators. One of our software tools can analyze visual properties (such as contrast, gray scale, texture, dominant colors, line orientations) and some dimensions of content (presence and positions of faces and bodies) of any number of images. Another tool can use the results of this analysis to position all images in a single high-resolution visualization sorted by their properties and metadata. We used these tools to visualize a variety of image collections, ranging from every cover of Time magazine between 1923 and 2007, a total of 4,535 covers, to one million Japanese manga pages.

Eric Fisher, Locals and Tourists, London, 2010. Visualization of photographs taken by locals (blue), tourists (red), or either group (yellow) in London, collected via Flickr. Base map © OpenStreetMap, CC-BY-SA; visualization © and courtesy Eric Fisher.
For our recent project, Phototrails, I’m working with art history Ph.D. student Nadav Hochman and designer/programmer Jay Chow to explore patterns among millions of photographs uploaded to social-media sites. We downloaded and analyzed 2.3 million Instagram images from thirteen global cities. One of our visualizations shows 53,498 photographs shared by people on Instagram in Tokyo over a few consecutive days. The progression of people’s dominant activities throughout the day—working, having dinner, going out—is reflected in changing colors and relative brightness. No day is the same. Some are shorter than others, or the progression between different activities is very gradual, while in others it is sharper. Together, these photographs create an “aggregate documentary” of Tokyo—a portrait of the city’s changing temporal patterns constructed from thousands of documented activities.
But are aggregated documentaries new? Dziga Vertov’s 1929 experimental film Man with a Movie Camera, the subject of one of our projects, portrays a single day in the life of a Soviet city and might be considered a precursor to the form. The film combines footage shot in three separate Ukrainian cities—Odessa, Khartiv, and Kiev—over a three-year period. Vertov wanted to communicate particular ideas about constructing a communist society that guided the selection and editing of his footage. Unlike Vertov, our visualizations of human habits rendered through Instagram photographs do not reflect a single directorial point of view, but this does not make them entirely objective. Just as a photographer decides on framing and perspective, we make formal decisions about how to map images, organizing them by upload dates, average color, brightness, and so on. But by rendering the same set of images in multiple ways, we remind viewers that no single visualization offers a transparent interpretation, just as no single traditional documentary image could be considered neutral. The tremendous diversity of social photography reflects the complex patterns of life unfolding in the world’s cities—this can never be fully captured in a single visualization, despite our ability to harness an excess of images.
—
Lev Manovich is the author of Software Takes Command (Bloomsbury Academic, 2013), Soft Cinema: Navigating the Database (MIT, 2005), and The Language of New Media (MIT, 2001).


